
Blog
Gauging the Gap
If you work in media, you’ve seen the headlines: Nielsen is delaying release of their monthly TV viewership report The Gauge. The delay leaves a meaningful data gap for those heading into Upfront season, where ~$17B in 2027 ad dollars will be committed.
Between the headlines, there’s a larger story unfolding. TV measurement is dizzyingly complex, notably opaque, and surprisingly up to interpretation. Yet - we use this data to fund the media and content of our futures as if it were a universal truth. One antidote to complexity is transparency - and that’s why I’m sharing a sample of signals we’re seeing at Samba.
Samba Signals
An old boss of mine often said, “don’t let data get in the way of the truth.” It sounded cynical, until I spent enough time in the industry to understand what he meant. Data is a signal. It gives you line of sight, but rarely carries the full story. Below is a sample of signals from Samba and other providers, and the methodological differences that may be driving disparities across sources.
Linear vs. Streaming: Labels Shape the Output
The race between linear and streaming TV makes a great headline. When the share of streaming view time surpassed that of linear for the first time in June 2025, I quoted it on conference panels, socials, even over Thanksgiving dinner. It’s relatable, memorable, and a sign of changing tides.
What often gets lost is that the definitions of linear and streaming shape the output as much as the behaviors they’re measuring. The Gauge classifies vMVPDs (e.g. Hulu + Live, YouTube TV) as linear because they deliver live content. At Samba, we classify those as streaming, because they’re consumed on an app over an internet connection. Same household, same screen, different label, different measurement output.
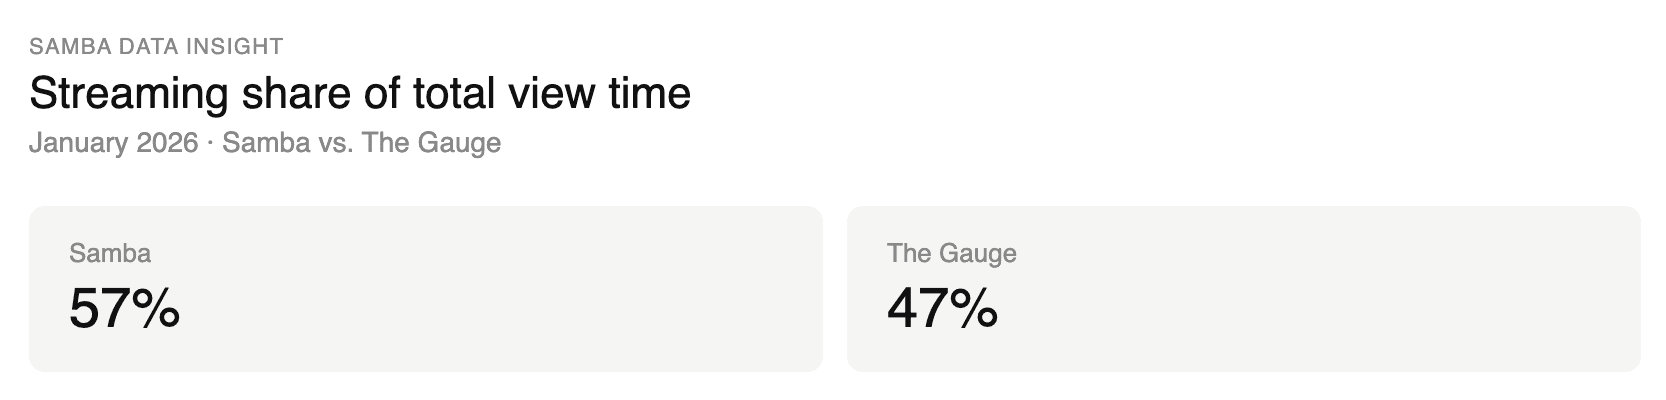
As you can imagine, these differences result in more than just a rounding error. In Jan 2026, The Gauge reported streaming share of view time as 47%. Samba reported 57%, a 10=point gap driven at least partially by the labels and categories we use in measurement.
February’s Signal
Nielsen was scheduled to release The February Gauge report using an updated methodology consistent with their currency-grade subscription data. After reportedly sharing early findings with select customers, Nielsen delayed, then deferred the report. The latest (as far as I’ve kept up) is that Nielsen will deliver the February 2026 Gauge report using non-currency data.
So - what did February numbers look like? The WSJ reported Nielsen’s findings showed linear’s share of view time at 48% in February - up 4-points over January. Four years of consistent January to February declines, and a sudden 4-pt jump is likely more aligned to methodology changes than behavioral ones.
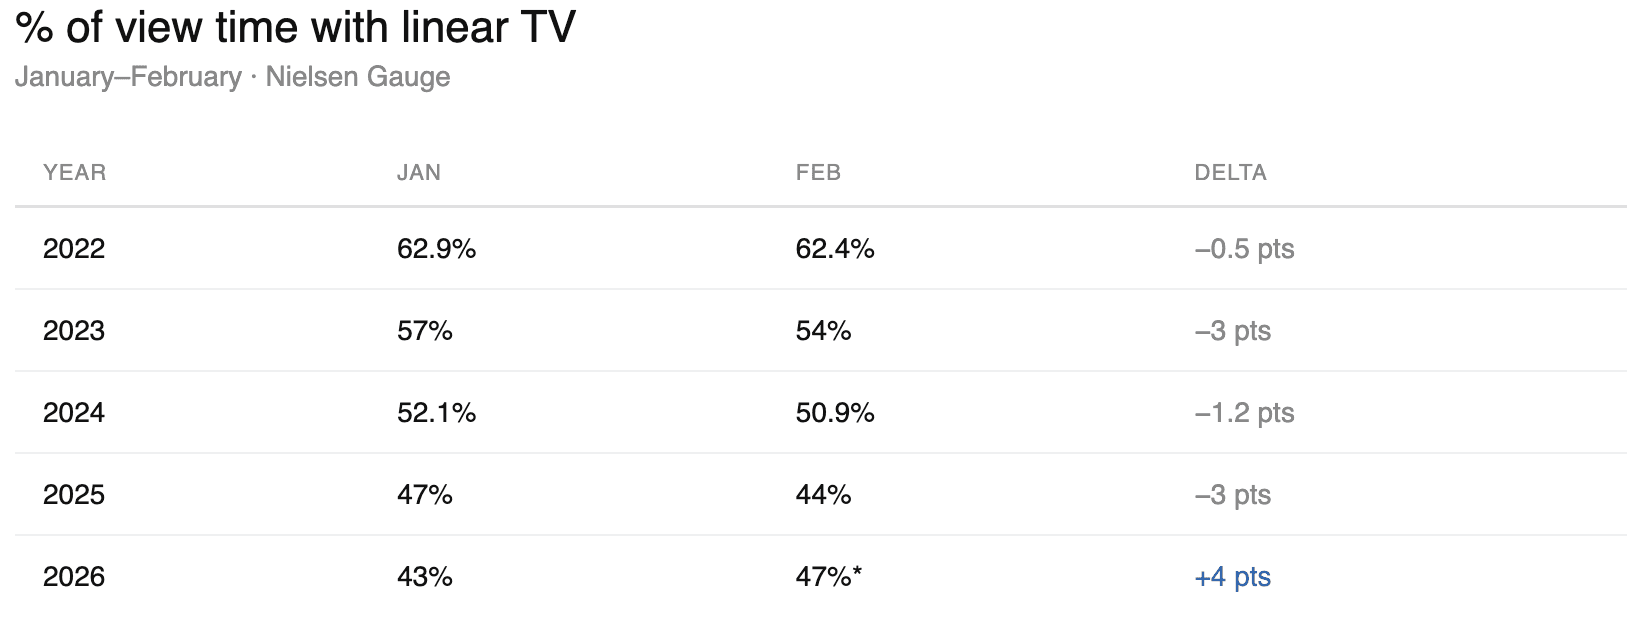
Yes, February had the Super Bowl and Olympics. But the Gauge showed a -.05-point linear decline Jan to Feb 2021, which also included the Winter Olympics. And Samba’s Feb 2026 data also shows a -1 point decline, consistent with historical patterns.
So - how can we explain the February Gauge numbers? DASH. TL;DR: Nielsen’s BD+P method requires the internet to transfer data, thus under-counting non-broadband viewership. I don’t think this is necessarily the reason. Many on the MRC committee felt that basing Nielsen’s Pay universe on its own panel was not the best way to estimate Pay.
To account for this, the MRC urged Nielsen to incorporate the ARF DASH TV Universe study into currency universe estimates. The DASH survey utilizes mixed-methods data collection (digital, phone, face to face) and a national probability sample. As I understand it, February was the first month Nielsen would incorporate DASH estimates into The Gauge.
More specifically, though, the change is influenced by how Nielsen defines linear TV using the DASH data. DASH output provides a level of granularity that enables subscribers to create their own schemas or definitions of linear TV. My understanding is that Nielsen is using any “any” method to categorize linear (vs. a more restrictive “only”), which also influences how numbers appear.
The DASH Pay estimates are higher than Nielsen’s estimates, and so when Nielsen integrated the DASH Pay estimates into their weighting scheme, Pay and therefore linear increased. The result? Nielsen Gauge reportedly showing increased share of view time on linear, and a decision to delay (or defer) release of February’s report using BP+D data, and not incorporating DASH. The result is a public discourse that contradicts subscriber-only currency data. (Not sure what this means but don’t know it to be wrong,)
More than Streaming vs. Linear: It’s a Content Story
Here’s what I’m noticing - while measurement companies and marketers are honed in on the race between linear and streaming viewership, consumers are just…consuming content. And the content story is a fascinating one to dive into.
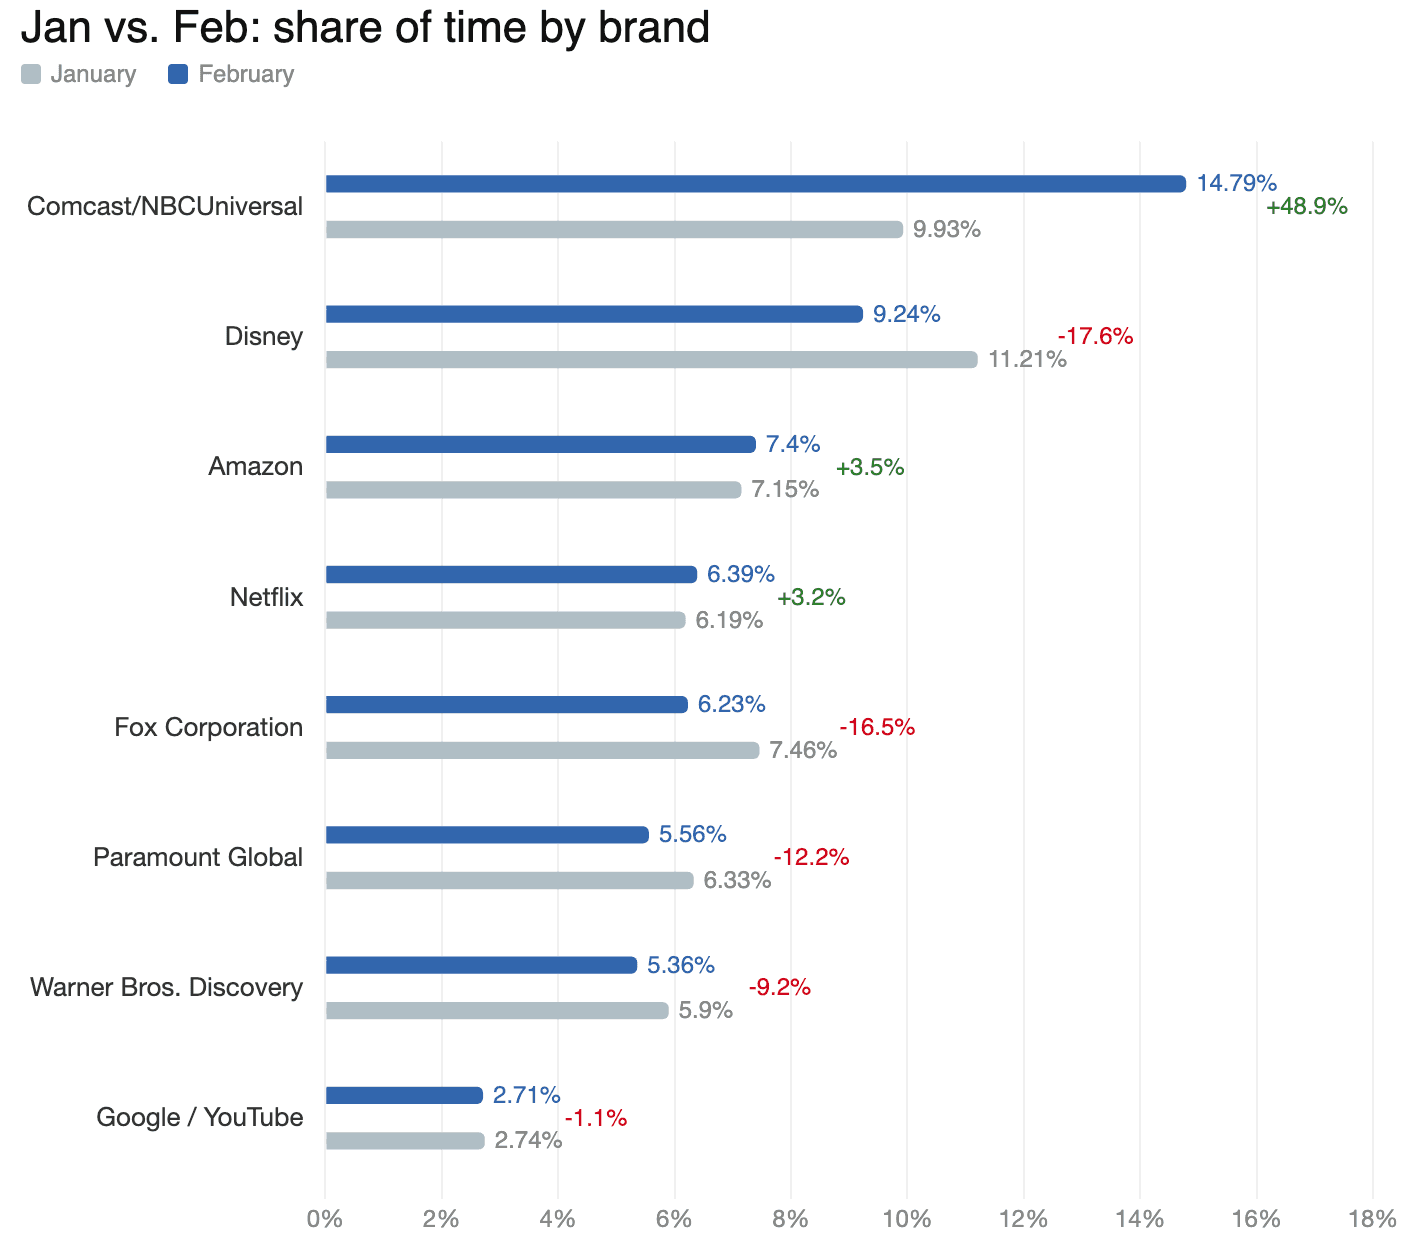
When we roll Samba’s February data up to the parent company level, Comcast / NBCU takes the top rank in view time Feb 2026, up by nearly 50% from January. That makes sense - NBCU owned February with Olympics coverage. The programming mattered more than the medium.
Also notable, linear-native brands dominate a majority of the top 5 across both months (Comcast/NBCU, Disney, Fox). The companies that invested in both linear and streaming (not or) are the ones capturing the most attention. And that’s a headline worth highlighting.
The Bottom Line
The February Gauge delay is a window into something the industry has been quietly navigating for years - measurement is hard, definitions are contested, and the data we treat as currency is more constructed than it appears.
That’s not throwing shade on any one provider, it’s just true. And it’s worth saying out loud, especially in an Upfront season where money moves on the basis of this data.
Transparency and education are the best tools we have against these complexities. That’s what I hoped to accomplish with this post. If you have questions, a different read of the data, or just want to talk shop - I’d genuinely love to hear from you.
Sources
↗ Variety – Gauge Delay Indefensible (Mar 24, 2026)
↗ Variety — Nielsen Will Delay March Gauge Report After Streamers Fret (Mar 13, 2026)
↗ Variety — Nielsen Delays Gauge Report Further, Following Streamer Backlash (Mar 21, 2026)
↗ Deadline — Nielsen Punts Monthly Gauge Report To April After Complaints (Mar 21, 2026)
↗ The Desk — Media Rating Council Questions Nielsen’s Revised Audience Estimates (Mar 2026)
↗ MediaPost — Oops… Nielsen Did It Again! Delays Recalibrated Gauge Until September (Mar 20, 2026)
↗ The Current — MRC Pushes Changes to Nielsen Big Data + Panel Before Upfront Season (Mar 2026)
↗ Nielsen — MRC Accredits Nielsen’s Big Data + Panel National TV Measurement (Jan 22, 2025)
↗ Variety — Nielsen National Ratings Accreditation Suspended by MRC (Sep 1, 2021)
↗ Variety — Nielsen National TV Ratings Regain Industry Approval (Apr 17, 2023)

Alyson Sprague
VP Measurement Science
Share: